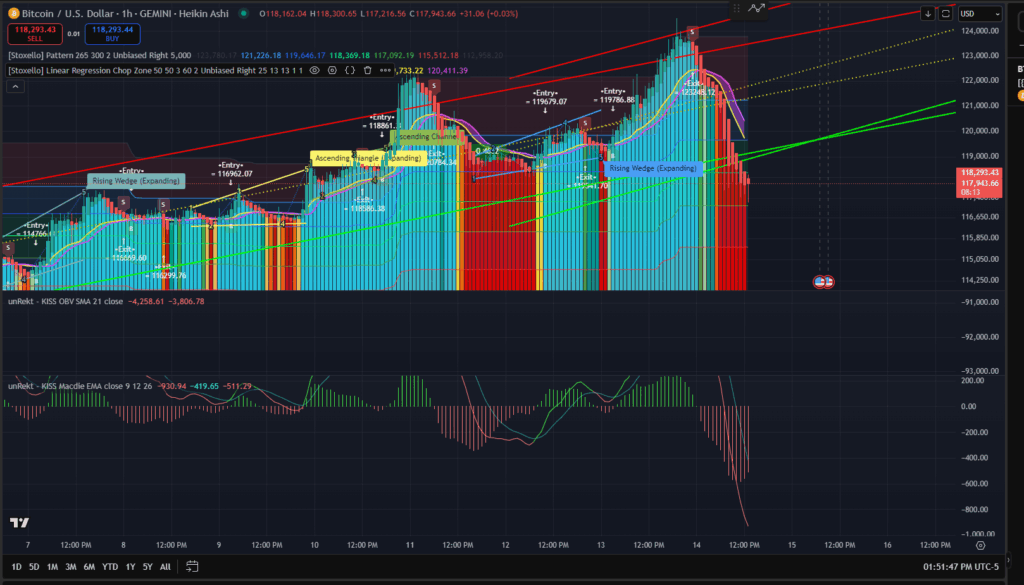
Here’s the 3-day probability forecast for Bitcoin based on the current 1-hour chart structure and indicators:
1. 🔼 Bullish Breakout — 30% Probability
- Trigger: A strong hourly close above $119,800 with rising volume and MACD turning up.
- Target Range: $122,000 – $123,500.
- Rationale: Price would reclaim the EMA ribbon and previous support, flipping sentiment short-term bullish.
- Risk: Still within a larger wedge breakdown context, so rallies may be sold into quickly.
2. 🔁 Consolidation / Sideways — 35% Probability
- Range: $117,100 – $119,800.
- Rationale: After a steep drop, BTC may pause to absorb selling pressure, forming a base before the next move.
- Signs: Low volatility, narrowing candles, MACD flattening.
- Implication: Good for short-term scalping but unclear direction until breakout.
3. 🔽 Bearish Continuation — 35% Probability
- Trigger: Hourly close below $117,000 with volume.
- Target Range: $115,500 – $114,200.
- Rationale: Rising wedge breakdown still active, MACD strongly bearish, OBV showing distribution.
- Risk: Support bounce could cause quick whipsaw if shorts overcrowd.
📌 Strategy Notes
- Swing Traders: Wait for a confirmed close outside $117k–$119.8k range.
- Breakout Traders: Focus on $119.8k upside break or $117k downside break.
- Bulls: Defend $117k with volume; otherwise, expect deeper pullback to $115k.
Here’s a detailed breakdown of what’s going on in your Bitcoin (BTC/USD) 1-hour chart:
1. Price Action
- Current Price: ~$118,293
- Price recently fell sharply from the ~$123,284 peak, breaking below short-term support.
- This drop came right after a Rising Wedge (Expanding) pattern completed — a bearish signal that played out as expected.
- The price is now sitting near the green ascending trendline (possible support zone).
2. Chart Patterns
- Multiple Rising Wedges & Ascending Structures before the drop — these generally indicate weakening momentum at highs.
- The ascending channel earlier in the chart showed bullish structure, but the most recent wedge breakdown has shifted momentum bearish.
- The prior Ascending Triangle breakout was followed by a strong rally, but buyers failed to hold above ~$123k.
3. Indicators
unRekt KISS OBV (Volume-based Trend)
- OBV is in negative territory (
-4,258.61), showing distribution (selling pressure). - The SMA line is sloping downward — further weakness likely unless volume reverses.
unRekt KISS MACD
- MACD histogram is deep in the red and widening, suggesting strong bearish momentum.
- Both the MACD and Signal lines are well below zero — no bullish cross in sight yet.
4. Support & Resistance
- Immediate Support: ~$117,100 – $116,650 (green trendline + horizontal level)
- Major Support: ~$115,500 – $114,200
- Resistance: ~$119,650 – $120,400 (20 EMA zone), then ~$122,000 – $123,300.
5. Short-Term Outlook
- Bias: Bearish in the short term unless price reclaims ~$119.8k with strong volume.
- If support around ~$117k fails, we could see a drop toward $115.5k quickly.
- A bounce from current levels would need to break above the purple EMA ribbon to flip bullish momentum.
6. Key Watch Points
- $117,000 Break → Bearish continuation to $115k–$114k.
- $119,800 Recovery → Short-term bullish reversal possible toward $122k.
- MACD cross & OBV recovery will be key for a sustained rally.
From this structure, it looks like BTC is in a post-rally correction phase, and bulls need to defend $117k to avoid deeper retracement.