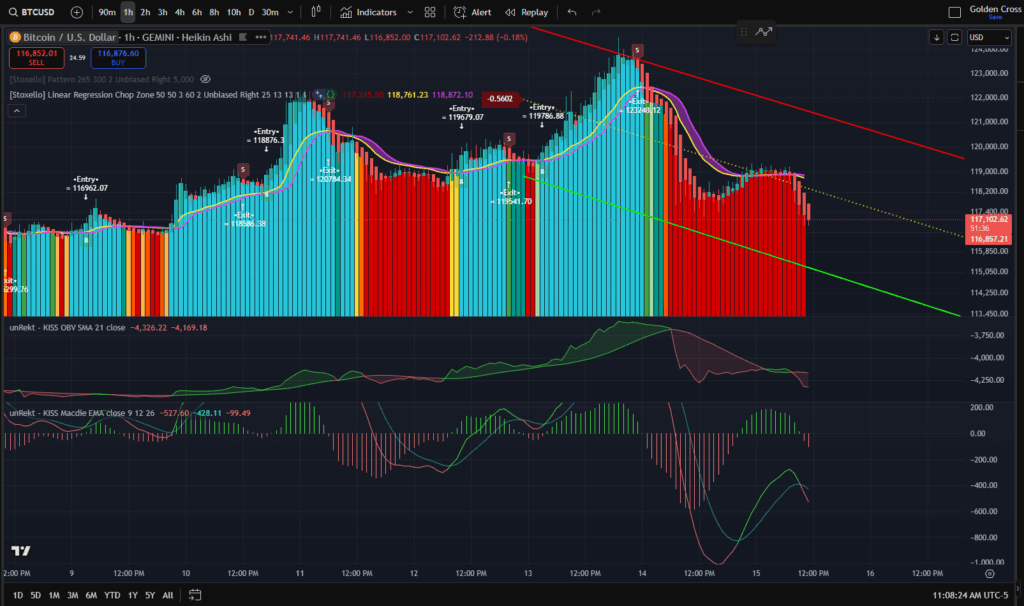
Here’s what I’m seeing from your 1H BTCUSD chart for the next 3 days:

🔍 Technical Snapshot
- Price: ~$117,102
- Trend: Currently in a short-term downtrend inside a larger descending channel (red lines).
- Indicators:
- Heikin Ashi candles: Predominantly red, showing strong selling pressure after a recent peak at ~$123,264.
- OBV (On-Balance Volume): Rolling over and heading lower — confirms declining buying strength.
- MACD: Bearish crossover and negative histogram, suggesting momentum favors sellers.
- Linear Regression Lines: Price is below midline, moving toward lower green trend support.
📉 Support & Resistance Levels
- Immediate Resistance: $118,760 – $119,800 (previous consolidation zone)
- Immediate Support: $116,850 – $115,900
- Major Support Zone: $113,450 – $114,200 (bottom green trend line)
🧭 3-Day Forecast
- Bearish Bias for Next 24h
- Momentum + volume indicators show weakness.
- Potential drop toward $115,900–$116,200 before finding short-term relief.
- Possible Consolidation (Day 2)
- If support at $115,900 holds, expect sideways movement between $116,000–$118,000.
- Breakout or Breakdown (Day 3)
- Bull case: Break above $118,800 could push to $120,500–$121,200.
- Bear case: Break below $115,900 could accelerate toward $113,500.
📌 Probability Estimate
- 🔽 Pullback to $115,900–$116,200: ~55%
- 🔁 Sideways consolidation: ~30%
- 🔼 Upside breakout above $118,800: ~15%